Ethereum's six-day rally hits January high as Bitcoin stalls
Ether rose for six straight sessions to about $2,732, its highest since January, while Bitcoin sat in a month-long range. Altcoin rotation is unconfirmed.
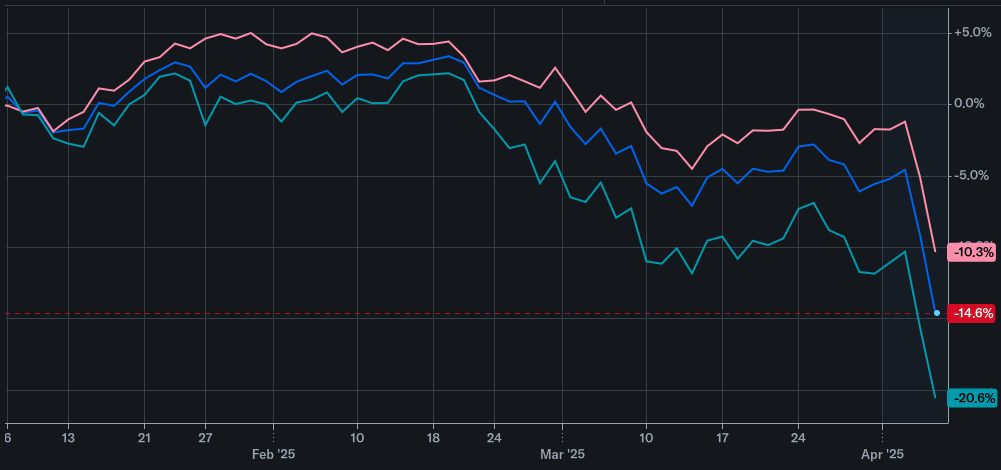
Ether is on a six-session winning streak. It rose about 3.3% on Monday alone to trade near $2,732 (its highest price since January).
What makes the run notable is how Bitcoin behaved over the same stretch. BTC spent most of it stuck around $82,000 in a 30-day consolidation, and only broke higher on Monday. A consolidation is a period when the price moves sideways in a fairly narrow band while buyers and sellers are roughly in balance.
Why ether is climbing
Analysts credit a mix of factors:
- easing pressure from the macro backdrop
- a recovery in global appetite for risk, alongside firmer stock markets
- the liquidation of short positions that had piled up in ETH derivatives
- busier layer-2 networks
- rising DeFi activity
Two of these terms are worth unpacking. Layer-2 networks are separate chains that process transactions away from the main Ethereum network and then settle the results back on it, which makes transactions cheaper while still relying on Ethereum for security. DeFi, or decentralised finance, covers lending, trading and other financial services run by smart contracts, many of them on Ethereum. More activity on both usually means more demand for ETH to pay fees. Our DeFi explainer and guide to Ethereum go into more depth.
Price levels in focus
The first hurdle is near $2,800 (the 0.382 Fibonacci zone). If ETH can hold above $2,700 then the psychologically important $3,000 level stays in play as a target.
Fibonacci retracement levels are lines drawn at fixed percentages of an earlier large move. Traders watch them because many people place orders around the same levels, which can make them act as temporary resistance or support. They are a map of where others are looking, not a forecast.
Not altseason yet
A few days of ether beating Bitcoin does not add up to "altseason". A broad rotation into altcoins is still "an early and unconfirmed signal". Money moving into large, established coins while Bitcoin pauses after a rally can reverse just as fast as it arrived. Our explainer on altcoins and altcoin season covers what a genuine rotation usually looks like.
What it means for Indian traders
If you trade altcoins on an Indian exchange, remember that they usually drop harder than Bitcoin when sentiment turns. A six-day streak is a reason to respect the trend, but not a reason to remove your stop-loss. Buying the seventh green candle is often how late entrants get caught when a good rally ends.
Costs matter too. Gains on ETH are taxed at a flat 30% in India, 1% TDS is deducted on sales, and a loss on one coin cannot be set off against a gain on another. Frequent switching between ETH and other altcoins to chase short moves can leave less in hand than the chart suggests.
What to watch next
- Whether ETH can close above the $2,800 zone, or gets rejected there.
- Whether it holds $2,700 on any pullback.
- Whether Bitcoin's move out of its range lasts, since a sharp BTC reversal would likely drag ether down with it.
This is not financial advice.
This article is AI-assisted, educational and general in nature. It is not financial advice and never a guarantee of profit. Every trade is at your own risk on your own exchange. See our risk disclosure and editorial policy.